
Phase Behavior of Hydrocarbon Systems

Share
Course Summary
Phase Behavior of Hydrocarbon Systems
Subject Area
Upstream Oil & Gas
- Enhanced Oil Recovery (EOR)
- Reservoir
- For bulk sales, questions, or any inquiries, contact admin at the following address: admin@alzare.com
- Certificates will be issued after successful completion of training.
Course Outline (Table of Content)
-
Introduction( 1 pdf)
- Introduction ( 1 pdf)
-
Phase behavior of pure substances
- The phase diagram
-
Two component systems
- Pressure-temperature diagrams
- Pressure-volume diagrams
-
Multi-component hydrocarbon
- Pressure-volume diagram
- Pressure temperature diagram
- Critical point
- Retrograde condensation
-
Multi-component hydrocarbon
- Oil systems (black oils and volatile oils)
- Retrograde condensate gas
- Wet gas
- Dry gas
-
Comparison of the phase diagrams of reservoir fluids
- Comparison of the phase diagrams of reservoir fluids
-
Reservoirs with a gas cap
- Reservoirs with a gas cap
-
Critical point drying
- Critical point drying
Cost of Course (USD)
$10
Who Should Buy This Course?
Petroleum Engineers, Reservoir Engineers, Drilling Engineers, and anyone interested in learning about phase behavior of hydrocarbon systems.
Why Should You Buy This Course?
Learning Objectives
Having worked through this course, the Learner will be able to:
- General.
- Define systems, components, phases, equilibrium, intensive and extensive properties.
- Pure components
- Sketch a pressure-temperature (PT) diagram for a pure component and illustrate on it, the vapor-pressure line, critical point, triple point, sublimation-pressure line, the melting point line, the liquid, gas, and solid phase zones.
- Define the critical pressure and critical temperature for a pure component.
- Describe briefly with the aid of a PT diagram the behavior of a pure component system below (left) and above (right) of the critical point.
- Sketch the pressure-volume (PV) diagram for a pure component illustrating the behavior above the bubble point, between the bubble and dewpoint and below the dewpoint.
- Sketch a series of PV lines for a pure component with a temperature below, at and above the critical temperature.
- Sketch the three dimensional phase diagram for pure component systems
- Two components
- Plot a PV diagram for a 2 component system and identify key parameters.
- Plot a PV diagram for a 2 component system and identify key parameters and the relationship to the vapor pressure lines for the two pure components.
- Sketch the critical point loci for a series of binary mixtures including methane and indicate how a mixture of methane and another component can exist as 2 phases at pressures much greater than the 2 phase limit for the two contributing components.
- Draw a PT diagram for a two component system, to illustrate the cricondentherm, cricondenbar, and the region of retrograde condensation.
- Draw a PT diagram for a two component system, to illustrate the cricondentherm, cricondenbar, and the region of retrograde condensation.
- Define the terms cricondentherm and cricondenbar.
- Explain briefly what retrograde condensation is.
- Multi-component systems
- Sketch a PT and PV diagram to illustrate the behavior at constant temperature for a fluid in a PVT cell. Identify key features.
- Draw a PT diagram for a heavy oil, volatile oil, retrograde condensate gas, wet gas, and dry gas. Illustrate and explain the behavior of depletion from the undersaturated condition to the condition within the phase diagram.
- Describe briefly with the aid of a sketch, the reasons for and the process of gas cycling, for retrograde gas condensate reservoirs.
- Plot a PT diagram for a reservoir with a gas cap to illustrate the gas at dew point and oil and bubble point.
- Miscellaneous
- With the aid of sketch, explain the process of critical point drying.
Course Preparation
Instructor Details

Instructor: Dr. Farad Sagala
Title: Petroleum Engineer, Reservoir Engineer, EOR Specialist
Please click my name.
Ratings & Reviews
No Ratings & Reviews given yet..
More Courses From Dr. Farad Sagala


Reservoir Fluids Composition
210 Views
Dr. Farad Sagala
Reservoir Engineer, EOR Expert
10

Hydrocarbon Gas Characteristics
201 Views
Dr. Farad Sagala
Reservoir Engineer, EOR Expert
10

Introduction To Reservoir Engineering
234 Views
Dr. Farad Sagala
EOR Expert, Reservoir Engineer
10

Oil Reservoirs Under Simultaneous Drives
243 Views
Dr. Farad Sagala
Reservoir Engineer
10

Reservoir Pressures and Temperatures
234 Views
Dr. Farad Sagala
EOR Expert, Reservoir/Petroleum Engineer
10
Similar Courses (Recommended Courses)

Dip Classification on Geological Image logs
529 Views

Zohreh Movahed
Senior Reservoir Geologist Consultant
50

Structural Bedding On Geological Image Logs
461 Views
Zohreh Movahed
Senior Reservoir Geologist Consultant
30
Sedimentary Bedding On Geological Image Logs
464 Views
Zohreh Movahed
Senior Reservoir Geologist Consultant
30

Stratigraphic Bedding On Geological Image Logs
428 Views
Zohreh Movahed
Senior Reservoir Geologist Consultant
30
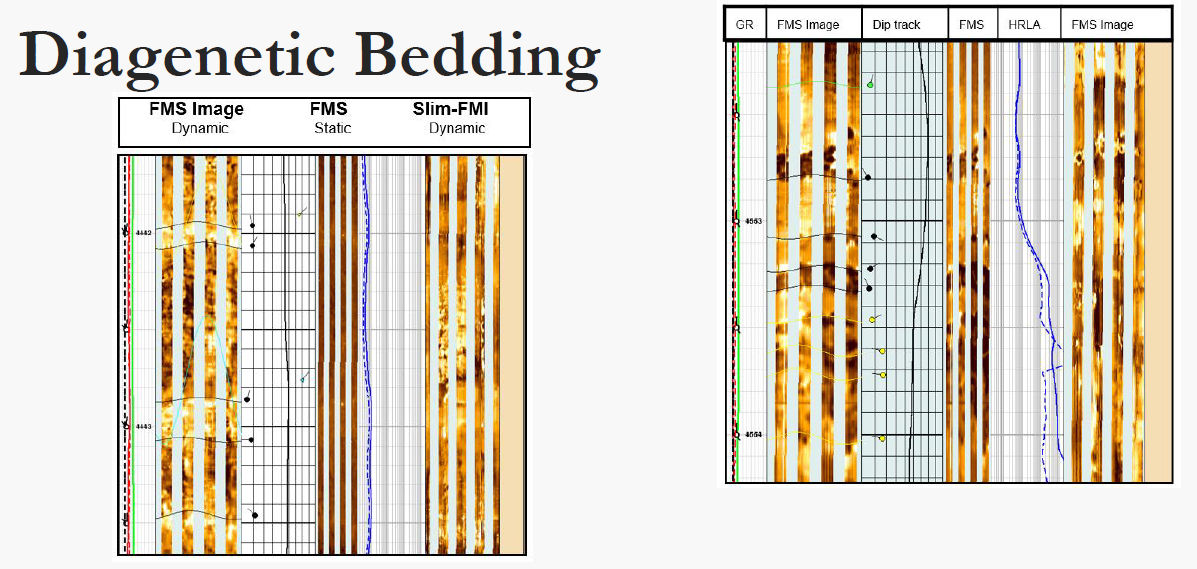
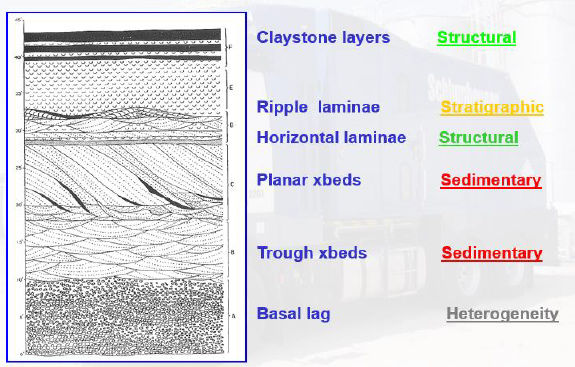
Diagenetic Bedding On Geological Image Logs
430 Views
Zohreh Movahed
Senior Reservoir Geologist Consultant
30

Fracture Classification On Geological Image Logs
1281 Views
Zohreh Movahed
Senior Reservoir Geologist Consultant
35