
Applied Petroleum Technology
Houston, Texas, United States
Applied Petroleum Technology
!


High quality analyses, consulting and interpretation services for the petroleum industry.
About Applied Petroleum Technology
APT is a complete provider of geochemistry services
Applied Petroleum Technology AS (APT) is a commercial company with offices in Norway, UK, USA and Canada and laboratories in Norway and the UK. The company, which was established in March 2000, offers high quality analyses and consulting services to the oil industry, within the areas of exploration and production and the disciplines of geochemistry and petroleum systems modelling.
Our unique mix of cutting edge technology and highly regarded laboratory services, together with staff boasting extensive offshore and operator experience allows us to provide our clients with a service like no other.
Description of Services
SERVICES:
1). Petroleum Geochemistry
Obtain an enhanced understanding of your whole rock and fluids system.
- Interpretation of Geochemistry Data
APT utilizes it experience to gain the maximum value from your petroleum geochemistry data. APT’s skilled geochemists have extensive experience in interpreting petroleum geochemistry data to produce single well reports, multi-well reports, regional studies, thematic studies, as well as incorporating information from other disciplines.
We can also operate within clients' exploration groups, for example during licencing or concession rounds, and provide expertise and knowledge that can reduce risk and enhance investments.
- Single well studies
APT can interpret the data generated by our personnel as well as data generated from other laboratories to give the industry an exhaustive interpretation and understanding of well results.
We are able to integrate data you hold, such as stratigraphy and mud systems, to form a framework for the interpretation. Through this process, APT will endeavour to provide details on potential contamination problems with the well results, source potential of your rocks and insights into reservoir properties.
Well interpretation example from the Nordland study.
Kerogen examination from the Weald study.
- Multi-well studies
APT can help to ensure that all of the wells you are reviewing have consistent data types, have carefully quality-checked results and can be compared with each other.
By comparing the hydrocarbon potential within formations from well to well, a regional picture of variations in source richness can be developed helping to gauge the likely expelled and accumulated fluids. This can be supplemented through the observation of fluids data and shows to integrated into migration models. Our carefully QC'd APvT database enables us to quickly compare a region to the nearby known fluid types.
- Thematic studies and databases
APT is proud to offer a large series of MultiClient studies available for purchase.
These studies are of regional exploration significance and include also specific general themes to assist with specific issues within a basin.
- Sample Preparation
APT uses geochemistry to ensure your samples are prepared in the most appropriate way to get the best results from analysis. Experience and precision in preparing your rock and fluid samples ensure the highest quality analysis and results that you can trust.
Cuttings samples
We receive cuttings samples in all conditions; washed or unwashed, bagged or canned, in very large quantities or very small amounts.
Knowledge of the drilling fluids used allows us to ensure samples are appropriately washed and treated. Our experience in removing the effects of oil based mud (OBM) has been shown to enhance the validity of analysis.
Sidewall cores (SWC) and cores
APT applies careful handling to SWC’s and cores ensuring the most appropriate preparation is utilised. We perform any required cleaning and removal of contaminants, always striving to maintain core integrity.
Analysis can be successfully achieved on core chips or core plugs.
Oils and gases
APT is able to deal with oils that have been stored in most types of approved or emergency containers. In general, oils require no preparation for the basic analytical procedures, some of which in themselves are in part or in whole preparation for more advanced analyses.
Gas samples may come in isotubes, isojars, cans, vacutainers, sealed bags, pressurised or non-pressurised metal containers.
- TOC & Bulk Pyrolysis
Leading geochemistry techniques and tools for evaluation of organic matter, hydrocarbon generation potential and maturity of your rock samples.
Total organic carbon (TOC) and bulk pyrolysis analyses form the basis of evaluating the geochemistry and maturity of rock samples
Through this stage we are able to provide suggestions and guidelines for further detailed analyses.
Total organic carbon (TOC)
Crushed rock samples are treated with acid to eliminate inorganic carbon and are then run through the Leco CS-632 combustion oven to measure the amount of carbon dioxide given off. This provides an indication of the total amount of organic carbon that each sample contains. We utilise standards to provide quality assurance on each batch of samples analysed.
Bulk pyrolysis
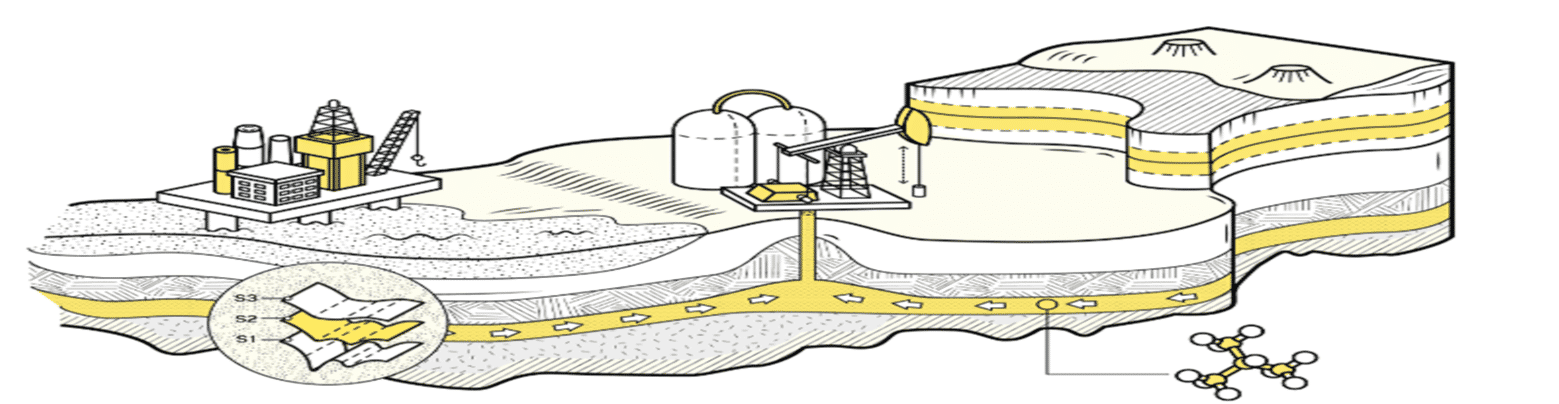
Bulk pyrolysis ('Rock Eval' or ‘HAWK’) is performed on potential source rocks to obtain information on hydrocarbon potential, organic matter type, presence of generated or migrated hydrocarbons, contamination from oil based muds (OBM) and maturity. We are also able to provide kinetics studies to better classify your source rock potential.
Utilising Rock Eval 6 and HAWK instruments, APT provides many measurements including:
S1 - Amount of hydrocarbons thermally extracted at 300°C
S2 - Amount of hydrocarbons produced from pyrolysis up to 550°C
S3 - Amount of CO2 released from organic matter at higher temperatures
Tmax: Temperature at maximum of S2 peak
- Vitrinite Reflectance
Vitrinite reflectance (VR) is a maturity indicator which can help define maturity thresholds for oil and gas generation in your rock samples.
How mature are your source rocks?
Vitrinite reflectance (VR) is a maturity indicator which can help define maturity thresholds for oil and gas generation in your rock samples. VR is commonly used to enhance calibration of basin modelling which APT can also carry out for you to better understand your basin maturity. Visual kerogen analysis using transmitted white and incident ultra-violet light can give both qualitative and quantitative information on kerogen type and maturity.
Vitrinite reflectance (VR)
APT specialises in high quality sample preparation followed by consistent, careful and geologically focused studies of each sample. Samples are prepared using bulk rock taken directly from ditch cuttings, sidewall cores (SWC), core chips or outcrop samples. Raw data plus a full interpretation report is provided.
Visual kerogen description
Description of kerogen compositions provide information regarding petroleum generation potential. Maturity assessments based on kerogen colours or fluorescence can be performed independently or in conjunction with visual kerogen assessments.
- Gas Composition Analysis
APT has gas chromatographs (GC) dedicated to gas composition analysis and mass spectrometers (MS) dedicated to isotope analyses including GCIRMS.
Analyse the composition of your gases.
Gas composition and isotope analysis can be performed on all types of gas in all types of containers (cans, bags, tubes, jars, pressurized cylinders). APT has gas chromatographs (GC) dedicated to gas composition analysis and mass spectrometers (MS) dedicated to isotope analyses including GCIRMS.
We can provide gas compositions in terms of C1, C2, C3, i-C4 ,n-C4, i-C5, n-C5, C6+, CO2, C2-C5 alkenes, H2, N2 and O2/Ar.
Gas isotope data include provision of δ13C and δD of C1, C2,C3, i-C4 ,n-C4, i-C5, n-C5 and δ15N for N2.
We also provide He, CO and H2S as optional analysis.
- Thermal extraction - Pyrolysis gas chromatography
Thermal extraction provides a gas chromatography (GC) of free hydrocarbons and the pyrolysis gas chromatography (PYGC) provides a GC of the breakdown products from the kerogen in the sample. Understanding the make-up of your fluids.
Thermal extraction provides a gas chromatography (GC) of free hydrocarbons and the pyrolysis gas chromatography (PYGC) provides a GC of the breakdown products from the kerogen in the sample.
Thermal extraction
APT uses an Agilent 7890B instrument with an MSSV injector and FID. During the process volatile components are collected and released into the GC column to assess the free hydrocarbons contained in the sample.
Pyrolysis gas chromatography (PYGC)
The same Agilent 7890B instrument is utilised to collect the pyrolysis products to examine the kerogen geochemistry.
-
Stable Isotope Analysis
Design the best stable isotope analysis program to extract the most information from your fluid samples.
Understand your fluid samples.
Carbon isotopic composition (δ13C) of a hydrocarbon is altered by the content of the source material, fractionation during fluid generation, and any fractionation during migration. APT can supply a wide range of isotope analyses depending on your exploration or production questions, and we would be happy to help you design the most suitable analysis program to get the best information from your samples.
Bulk isotopes on oils
Carbon isotopes analyses can be performed on whole oils plus saturates, aromatics, polars, and asphaltene fractions.
Compound-specific isotope analysis (CSIA or GCIRMS)
Carbon isotope analyses are performed on individual compounds, including major peaks in oils (alkanes, aromatics, and light hydrocarbons).
- Extraction & Group Type Separation
Understand the richness of your source rocks through geochemistry.
Extractable organic matter (EOM) from source and reservoir rock samples provides an indication of richness. The laboratory quantifies the asphaltenes plus saturates, aromatics and polar fractions using medium pressure liquid chromatography (MPLC). We are also able to obtain the Group type distributions (SARA) using TLC by Iatroscan.
Group type separation
De-asphaltening - Prior to medium pressure liquid chromatography (MPLC) asphaltenes are precipitated from rock extracts and oils.
MPLC – Measurement of saturated, aromatic and polar fractions, which can be run for isotopes, gas chromatography (GC) and gas chromatography - Mass spectrometry (GC-MS).
Solvent extraction
Crushed samples are run through the Soxtec Tecator instrument to determine the amount of extractable organic matter.
- GC, GC-MS and GC-MS/MS
State-of-the-art facilities for GC, GC-MS, and GC-MS/MS to assess saturates/aromatics/polar fractions and whole oils.
APT is proud to offer state of the art facilities for GC, GC-MS and GC-MS/MS to assess saturates/aromatics/polar fractions and whole oils.
Gas chromatography (GC)
GCs provide detailed information on the saturates fractions and whole oils. Measurements such as Pristane/Phytane, Pristane/nC17, Phytane/nC18 and CPI ratios are derived to allow you to better characterise your fluids. GC of whole oils also includes high resolution of gasoline range components and a full suite of industry standard parameters.
Gas chromatography - Mass spectrometry (GC-MS)
GC-MS analyses are performed on saturates/ aromatics/polar fractions and whole oils. Quality assurance is achieved via regular analysis of standards, as specified by NIGOGA.
Three main types of analyses are routinely available:
- High resolution GC-MS (HR-GC-MS-SIR)
- Low resolution GC-MS (LR-GC-MS-SIR)
- Low resolution GC-MS-MS
Gas chromatography - Mass spectrometry / Mass spectrometry (GC-MS/MS)
GC-MS/MS provides chromatograms that are free from the type of interference that can obstruct evaluation of parameters from normal GC-MS analysis. This can be especially useful for compound classes that are present in very low abundance.
- APvT
A carefully constructed database of PVT data to enable better calibration of models and gain insight into likely fluid types.
The application of PVT data to deepen the understanding of a petroleum system is not new and was proposed more than 20 years ago (e.g. di Primio et al. 1998), however the application of this data type has largely remained in the engineering disciplines, most likely because of (a) lack of readily accessible, regional databases of this datatype and (b) a lack of integration between the geoscientific and engineering disciplines.
Recently He & Murray (2019) have advocated an approach, termed top down petroleum systems analysis, that they define as the interpretation of fluids (accumulations, shows, seeps, and dry holes), their bulk properties, including PVT data (GOR/API/Psat etc) and their distribution in the geological context and PT space to constrain the petroleum system and allow better informed inferences on the location and properties of yet-to-find hydrocarbons.
The geoscientific data released by the OGA provides opportunities to view a range of data types, at scale, across the UK sector of the North Sea. A spatially referenced and easily manipulated PVT database for the UK sector of the North Sea has been created which allows:
- Visualisation and integration of data PVT type data at the basin scale – providing deep insight to sourcing and migration processes
- Easily accessed PVT analogues
- Physical property correlations
- Input data for prospect phase risking
2). Petroleum Systems Modelling
Full 1D and 3D basin modelling to help you understand your petroleum systems.
Integrate all your data to gain a deeper insight into your region
- Fully Integrated Petroleum System Modeling
Use fully integrated petroleum systems modeling to understand your exploration risk and potential.
Understand your exploration risk and potential through fully integrated petroleum system modeling
APT routinely carries out detailed models for basins all over the globe.
Each study is always different and each presents a new set of questions and challenges to address.
Some of these include:
- How mature are my source rocks and what fluids are they capable of expelling?
- Do all my play elements occur at the appropriate times to reduce my exploration risk?
- What was the thermal development of my basin and does heat flow vary across the region?
- Can we gain an enhanced understanding of the likely phase in our identified traps?
- Is it feasible for expelled fluids to reach our structures via mapped migration pathways?
- How critical are the fault and top seals to the success of our prospects?
- Is there evidence of biodegradation and how does this change?
- What is the impact of salt presence on the region?
- Can we rank the prospects based on different petroleum system scenarios?
1D basin modelling
We can help you understand the burial history of your area.
A full set of 1D models can be constructed to reveal the maturation of your source rocks, the timing of expulsion and provide thermal calibration for 3D models. 1D models can also give insight into compaction, porosity, pressure and other trends within the well.
3D basin modelling
Visualise your system in 3D.
Through setting up a carefully calibrated 3D model we can gain insights into the behaviour of the fluids in the subsurface and help de-risk your prospective area. APT can help you understand the source rock maturity, expulsion efficiency, migration pathways, top seal analysis and much more.
- 1D Basin Modelling
Gain insights into the thermal regime and source rock potential of your area of interest.
Advanced 1D modelling for the industry
1D models may be of individual wells, or of pseudowells based upon tops and thicknesses from either seismic or geological reconstructions. They provide burial, thermal and maturation histories and the timing of hydrocarbon generation.
1D model output example.
Prospect location in Trinity model.
1D modelling process
1D modelling is widely used for calibration of thermal history for subsequent 2D/3D modelling. In poorly explored and undrilled areas, 1D modelling provides valuable insight into maturation and the timing of possible hydrocarbon generation and expulsion from prospective source rock intervals. In 1D models, only vertical migration of compaction-derived formation water is simulated to model porosity, permeability and pore pressure.
- 3D Basin Modelling
Gain a 3D visualization and understanding of your basin through geochemistry with APT.
3D visualisation and understanding of your basin
3D models are the most comprehensive models. They are based upon gridded depth structure maps, usually interpreted from seismic data, and are carefully calibrated utilising 1D models. A geological model will ideally generate some concepts for migration mechanisms from the source rock into the carrier bed.
Models can then test the timing of oil and gas generation, the timing of expulsion and migration relative to trap formation, the availability of migration conduits and the likelihood that prospects have been charged.
Estimates of the timing of migration of light hydrocarbons from gas-mature source rocks may indicate possible gas influx and oil spilling, together with modification of the accumulation’s composition and phase.
Flow path (or ray tracing) migration modelling is performed on a specific depth surface at a specific point in time, most commonly corresponding to peak generation and expulsion. This surface could be either a supplied depth map or a paleo-depth surface representing a selected carrier bed extracted from the 3D model.
Hydrocarbons are introduced ("injected") into the carrier interval, the geometry of which should be representative of the migration pathway at the time of generation and expulsion. In addition to the top surface, it is possible to include the carrier bed thickness and porosity/permeability and top–seal pressure.
Flow path analysis provides information on drainage areas, migration routes, accumulations, spill points, column heights and volumetrics. Its main advantages are simplicity and short simulation times, thereby allowing detailed sensitivity analysis.
Rapid flow path analysis based upon carrier bed geometries and properties may be used to determine drainage areas and reservoir volumetrics prior to full 3D migration modelling.
Full 3D simulation
We provide full 3D simulation of Darcy flow, flow path or, more commonly, a hybrid combination of these two methods.
Full 3D migration modelling encapsulates expulsion from the source rock into the carrier interval, modification of the carrier geometry throughout geological time, and also allows for contributions from multiple source rock intervals.
Full 3D migration is most suited to areas that are geologically very well understood, the source rock intervals are well defined and (ideally) the mode of migration via a carrier bed towards a prospect is understood, and the effects and timing of over-pressure development, fault activity etc. can be defined.
The main disadvantage of full 3D migration is that it can be computationally intense, and can involve long simulation times. APT's use of Zetaware's 3D modelling package, Trinity, enables rapid running of simulations and we are able to relatively quickly provide an overview of the region.
3). Multiclient Studies
Use our searchable map to view all our multi-client studies and publications.
| Region | Study |
|---|---|
| Atlantic | Flemish Pass and Outer Ridge Geochemistry Study |
| North Sea | Petroleum Geochemistry of the North Horda Platform-Agat area |
| North Sea | North Sea Cross Borders Oil Families |
| North Sea | Oil Populations of the Utsira High |
| Norwegian Sea | Sand distribution in Melke Formation (Middle-Late Jurassic) along the Nordland Ridge and Halten Terrace. |
| Barents Sea | The Lower Triassic, Permain and carboniferous of the Barents Sea: part one Biostratigraphic review, Part two: XRF database |
| Barents Sea | Petroleum Geochemistry of the Nordkapp Basin |
| Barents Sea | Petroleum Geochemistry of the Finnmark Platform |
| Other | APT Source Rock Database |
| Atlantic | Porcupine Basin Hydrocarbons; A Detailed Geochemical Characterisation of Provenance and Quality |
| Atlantic | Geochemical evaluation of the petroleum systems of the North Atlantic conjugate margins |
| Atlantic | Southern Grand Banks Geochemistry Study |
| Atlantic | Faroe-Shetland Basin basement characterisation and thermal calibration database |
| Atlantic | Geochemical evaluation of oil provenance and quality West of Shetland Islands |
| UK | The Weald – Wessex Basins petroleum system A new assessment of the character and maturity of source rocks of Southern England |
| North Sea | Namurian Gas Study - Southern North Sea |
| North Sea | Implications of oil variability along the eastern edge of the Central Graben for exploration risk in marginal areas |
| North Sea | The Petroleum Geochemistry of NOCS Quadrant 25 |
| North Sea | Petroleum geochemistry of the Stord Basin, Norwegian North Sea |
| North Sea | Unusual oils of the Norwegian offshore continental shelf |
| North Sea | Oil Populations and Migration along the Danish-Norwegian border |
| North Sea | Petroleum geochemistry of Northern Viking Graben |
| North Sea | Petroleum geochemistry of the greater Statfjord area |
| North Sea | The Drake Formation: Source Potential and Identification of Contributions |
| North Sea | Petroleum Geochemistry of the Greater Bream-Brisling-Yme Area |
| North Sea | Source Rock Geochemical Data and Interpretation, Draupne Formation, Norwegian North Sea |
| North Sea | Petroleum Geochemistry of Upper Jurassic Source Rocks in the North Horda Platform Area |
| Norwegian Sea | Proposed Evidence for a Triassic/Palaeozoic Source in the Helgeland Basin - Fact, Fiction or Wishful Thinking |
| Norwegian Sea | The Trøndelag Platform - A petroleum province? |
| Norwegian Sea | Petroleum Systems of the Northern Haltenbanken Area |
| Norwegian Sea | Petroleum Geochemistry of the Møre Margin & Agat-Ormen Lange Trend |
| Norwegian Sea | Oil Populations in the High Temperature – High Pressure areas offshore Mid Norway |
| Norwegian Sea | Oil Populations in the Draugen Field Area |
| Norwegian Sea | Geochemistry of Ormen Lange, Midnattsol and Ellida |
| Norwegian Sea | Petroleum geochemistry of the Gjallar, Nyk and Utgard High area |
| Norwegian Sea | Petroleum Systems Modelling of Nordland I-III |
| Barents Sea | Inferences for ages of source rocks for oils from the Barents Sea |
| Barents Sea | Wireline Log Source Rock Evaluation and 1D Modelling, Nordkapp Basin, Norwegian Barents Sea |
| Barents Sea | Database of composition and isotope ratio data for tested gases and headspace/occluded gases: Norwegian Barents Sea |
| Barents Sea | Apatite fission track analyses, Loppa High wells 7120/1-1R2, 7120/1-2, 7120/2-1 and 7120/2-2, Norwegian Barents Sea |
| Barents Sea | Norwegian Barents Sea, 1D Petroleum Systems Modelling |
| Barents Sea | Hydrocarbon Characterisation of Loppa East/Bjarmeland Platform Discoveries |
| Barents Sea | Carboniferous source rocks from Svalbard and the Norwegian Barents Sea |
| Barents Sea | Maturity Variations along the Western Margin of the Barents Sea |
| Barents Sea | Petroleum systems of the Greater Wisting-Hoop Area |
| Barents Sea | Petroleum Systems of the Bjørnøyrenna Fault Complex, Norwegian Barents Sea |
| Barents Sea | Hydrocarbon Characterisation of Finnmark West Discoveries |
4). Software
APT offers bespoke software solutions to compliment our analysis and integration services.
Complimentary services to your data analysis - software packages developed inhouse and tailored training courses
-
Girasol
APT Girasol is an intuitive software toolkit that allows users to rapidly process, display, and interpret wellsite gas data.
-
EASYQUAN
EASYQUAN enhances your experience with quantifying and analyzing all types of GC and GC-MS data.
-
SI-PIONA
SI-PIONA provides a method for detailed group type analysis of gasoline and petroleum naphtha.
5). APvT Database
Obtain the maximum value from your PVT data and better predict fluid types.
A carefully curated databse of PVT data to enhance modelling and fluid predictions.
-
APvT
A carefully constructed database of PVT data to enable better calibration of models and gain insight into likely fluid types.
6). Training
In-person and on-demand training on a range of applied topics in geochemistry and basin modelling.
In-person and on-demand training on a range of applied topics in geochemistry and basin modelling.
- Module 1: Introduction to Petroleum Geochemistry Course
Providing an introduction to all of the APT training modules.
- Module 2: Source Rocks
Source rocks; characterization, depositional environments, and predicting hydrocarbon type.
- Module 3: Petroleum
Petroleum; characterization, formation, gas, and composition.
- Module 4: Petroleum Systems Analysis and Basin Modelling
Introduction to the petroleum system concept and approaches to petroleum systems analysis.
- Module 5: Applications of Biomarkers
Providing an understanding of what biomarkers are, where they come from, and what they can be used for.
- Module 6: Conventional Reservoir Geochemistry
Learn the reasons for differences in fluid compositions, how reservoirs are filled and mix, and more.
- Module 7: Geochemistry in Resource Plays
Understand the diversity of what are termed ‘unconventional plays,’ ‘quantified’ vs ‘qualitative’ production allocation, and more.
- Module 8: Organic Petrology
Organic petrology; maturity, applications, and thermal history tools.
- Module 9: Well Site Gas Analysis
Understand the origin of the gases collected during the drilling processes, how the data is reported by service companies, and more.
- Module 10: Non-hydrocarbons in gas
Understand the origin of non-hydrocarbons in natural gas and how their presence may be predicted.