

DYNAMIC GRAPHICS, INC.
Lafayette, California, United States
DYNAMIC GRAPHICS, INC.
!


Innovative software solutions for the petroleum, environmental, and earth-related sciences.
About DYNAMIC GRAPHICS, INC.
DYNAMIC GRAPHICS,® INC. partners with our clients to solve spatial analysis problems in the petroleum, environmental, and earth-related sciences. Over the past five decades, we have been the premier provider of geospatial solutions with our innovative, easy-to-use software and outstanding support services.
We offer three separate packages: CoViz® 4D, WellArchitect®, and EarthVision®. While each is a standalone product, serving a different purpose in the hydrocarbon development workflow, when used in conjunction, they provide a collaborative multidisciplinary environment that offers dramatic benefits.
All of our software products are designed to meet clients’ practical application needs, industry standards, and our own stringent quality-control requirements. Each product is thoroughly tested and documented prior to release. We provide a complete spectrum of regularly scheduled and customized training courses prepared by our full-time educational services staff. Once our products are in use at a client site, our technical support personnel are available to offer their expertise and to answer any questions that may arise.
In today’s fast-changing business environment, Dynamic Graphics believes that the key to success is to offer a variety of products and services designed to address a wide range of clients’ needs. Our software can be licensed on a perpetual basis, as an annual lease, or on a client-determined flexible rental schedule. Our Dynamic Graphics Project Services are also available for data consulting services on a contract basis for clients with intermittent project needs or limited modeling expertise or resources.
Description of Services
1. COVIZ 4D
Dynamic Visual Analytics for Better, Faster and More Confident Decisions
COVIZ 4D leads the industry in providing a quantitative visual environment for reservoir management and 4D seismic analysis.
Understanding the changing response of a reservoir over time is critical for optimizing production and development decisions. CoViz 4D makes it possible for multi-disciplinary users to simultaneously view and interrogate datasets from throughout the asset development team—regardless of the original data source. Understanding through data fusion—powerful in 3D—increases enormously when used in 4D: The unique temporal functionality in CoViz 4D allows users to visualize how development decisions affect reservoirs through time.
2. WELLARCHITECT
Advanced Directional Well Planning / Survey Management
Developed in conjunction with Baker Hughes Company, and designed with collaboration at its heart, WellArchitect is an advanced well planning and survey management system for integrated planning and drilling of directional wellpaths with or without earth models, reservoir grids, and other geospatial surface and subsurface data.
WellArchitect 6.0 includes several new advances in directional drilling ⁄ well planning software. Some of the major new features include 3D visualization of ahead-of-the-bit clearance results while actively drilling; ability to monitor simultaneous drilling while auto-clearances are run ahead-of-the-bit; constant toolface curves and “splitting” of profiles for more flexible well planning; a new database QA tool at every level; and support for the new SPE Wellbore Positioning Technical Section Stop Drilling HSE Risk (2017) rule.
3. EARTHVISION
Software for 3D Modeling and Visualization
EarthVision developed by Dynamic Graphics, offers software for 3D model building, analysis, and visualization, with precise 3D models that can be quickly created and updated. Accurate maps and cross-sections, reservoir characterization, and volumetric analysis are made easy. EarthVision’s advanced 3D ⁄ 4D Viewer enables model examination and interrogation in the context of datasets from throughout the asset development team, which serves to improve and simplify quality control, well planning, and communication to management, investors, partners, and other team members.
EarthVision 12.0 offers greater support for DGI multigrid file visualization; Cloud-native data loading support for select file types; New features and performance around Lidar data; updated Python and DGI Libraries; General visualization changes and enhancements.
What we do
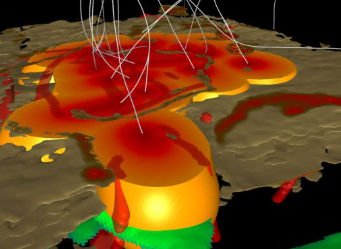
Monitoring CO2 Injection Volumes in the Subsurface—The Sleipner Field
Subsurface CO2 injection and storage is a proven technology for keeping carbon dioxide out of the atmosphere and helping to achieve net zero goals. However, robust monitoring of the injection process is critical to ensure and verify that there is no leakage or unexpected movement of the carbon dioxide post-injection.
Advanced 3D Well Planning for Improved Wellbore Collision Avoidance
Planning a trajectory can be challenging in an open field, but when a drilling facility has dozens of existing wells, clearing high-pressured offsets can add extra complexity.
Flight Planning and Route Analysis Via 4D Scene Building
The state-of-the-art CoViz® 4D software from Dynamic Graphics,® Inc. is extremely powerful for data ingestion/integration, and quantitative spatiotemporal visualization across multiple data types. These unique capabilities are already leveraged by users across many disciplines and industries.
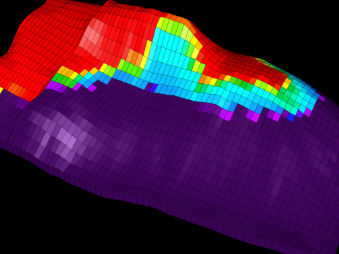
Oil Reservoir Compaction; Risk Reduction for Drilling Infill Wells
During production, North Sea chalk reservoirs are commonly prone to severe compaction due to reduction in pore pressure—this increases the load on the rock matrix, resulting in compaction. In some extreme cases the result is seabed subsidence on the order of 10 meters. This magnitude of subsidence causes challenges to the existing production infrastructure, including the integrity of the drilled wells, and leads to geomechanical changes in the subsurface which can impact seismic travel times.
Reservoir Pressure Anomalies: Investigating Causes with CoViz 4D
In a California onshore field, with hundreds of closely-spaced production and injection wells, a horizontal production well was experiencing occasional dangerously high pressure and temperature spikes – leading to a serious health and safety issue.
Well Location Optimization with Visual and Quantitative Analysis
An onshore team was tasked with producing a list of potential well landing locations based on attributes in a geological model. Four pad locations in the field were each given a set of 12 wells arranged in a radial pattern; the model’s potential target area covered a Z range of about 1650 ft. The well landing locations needed to be optimized to hit the model’s high Net to Gross (NTG) and Gamma Ray (GRD) areas because these two attributes had high confidence amongst the team. Finally, the potential well path landing options had to be easily visually ranked.
Forward Seismic Modeling in a North Sea Reservoir
Improved, flexible and faster access to critical data is vital for fully informed decision making in today’s multidisciplinary asset development teams. It is also imperative to include the highest fidelity quantitative temporal data when building reservoir models to improve development plans and maximize returns on investment.
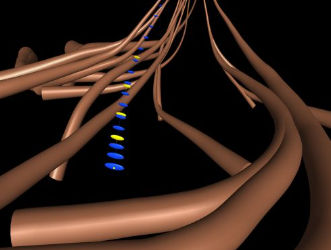
Fracture Propagation Analysis from Inter-well Tracer and Microseismic Data
Following an inter-well tracer study for their field, an onshore group was given the results of the study in the format of spreadsheets and 2D charts. The spreadsheet data were particularly difficult to interpret and the group felt a 3D/4D visualization of the tracer results was critical to fully understand them. Furthermore, the group wanted to integrate the tracer data with other field data that could potentially help with the tracer interpretation, including offset well trajectories, well logs, property models, microseismic data and horizon surfaces.
4D Seismic Assisted History Matching—Closing the Loop in Reservoir Simulation
The traditional technique of manually adjusting reservoir simulation models to achieve a history match is time consuming and problematic at best; adding 4D seismic data to the equation only increases the complexity of the task. The inclusion of 4D seismic, however, results in better constrained simulation models and a greater understanding of the uncertainty inherently associated with models.
Horizontal Well Planning from Simple Heel-Toe Locations
An onshore group had a busy rig schedule for their large drilling program and needed to find ways to save time when going from a prospect to a producing well. Specifically, the group was challenged with streamlining how to quickly turn prospective well locations drawn on a map, into viable well design plans for the drilling department.
Regional Structural Geological Modeling Through Fault Data Correlation
Onshore projects often span extensive areas, and coarse, basin-wide models are used in activities such as assessing regional stress patterns and stratigraphic trends, as well as planning rig schedules.
Common Risk Segment Mapping for Cuttings Reinjection
Drilling scenarios such as infill drilling, water flood optimization, cuttings reinjection and CO2 injection often require an in-depth study of a field to determine the optimal drilling location within a set of restrictions. Quantifying the decision making around the process requires the integration of dozens of diverse datasets, often containing dynamic information and spanning a range of realizations.
Reservoir Simulation Ensemble Analysis via CoViz 4D Visualization and Jupyter Notebook Calculations
Dynamic Graphics provides powerful, interactive functionality to simplify software usage, but it has always recognized the need to prevent the limitations of a “black box” environment, allowing for the extension and customization of the tools by providing users with access to the underlying modular functionality. This enables clients to build their own solutions for precise problem solving, analysis, and 4D visualization without having to navigate the existing buttons and toolbars
A Relief Well Planning Case Study
In the Gulf of Mexico, a drilling trajectory needed adjusting due to a recent update to the reservoir model. Although the change to the trajectory was minor, the shift of the placement of the 14-inch and 11 7/8-inch casing shoes invalidated the previously designed relief well plans. With a fast-approaching deadline for drilling operations, the well planning team had little time to make a new relief well plan that could (1) achieve the objectives of the updated target plan, (2) meet industry-standard relief-well design constraints, and (3) be ready to send for permitting.
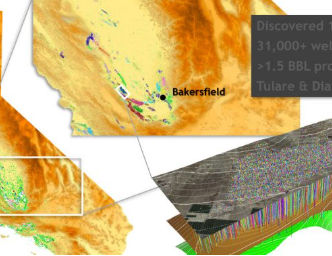
InSAR Data Analysis of the Belridge Field
Interferometric Synthetic Aperture Radar (InSAR) is a powerful remote sensing technique that produces a very detailed picture of the shape of the ground surface. The data returned are so precise that they can reveal changes in the elevation of the earth down to the level of millimeters per day, enabling very small changes in surface elevations to be quickly discovered, which can be critical to land management.
Infill Drilling Placement using Conditional Seismic Attribute Filtering
Infill drilling aims to tap previously undrained reserves in a mature hydrocarbon field. By definition, infilling happens later in field life and hence involves the analysis of greater volumes and a greater diversity of a priori data. Furthermore, the economics of infill drilling can be marginal. Therefore, a rigorous quantitative decision-making process is necessary to justify the economic risk required to implement drilling and production plans.